
Crypto Technical Indicators Explained
Our algorithmic engine goes beyond basic charting by processing raw market data into over 30 distinct technical metrics. This guide details every specific indicator calculated by our system, explaining the mathematical methodology, and interpretation standards used to generate our signals.
Real-Time Processing: Our engine utilizes a "Rolling Candle" methodology. For incomplete timeframes (e.g., a weekly candle on a Wednesday), we dynamically construct the current candle using the latest available data to ensure indicators are never lagging behind the live market.
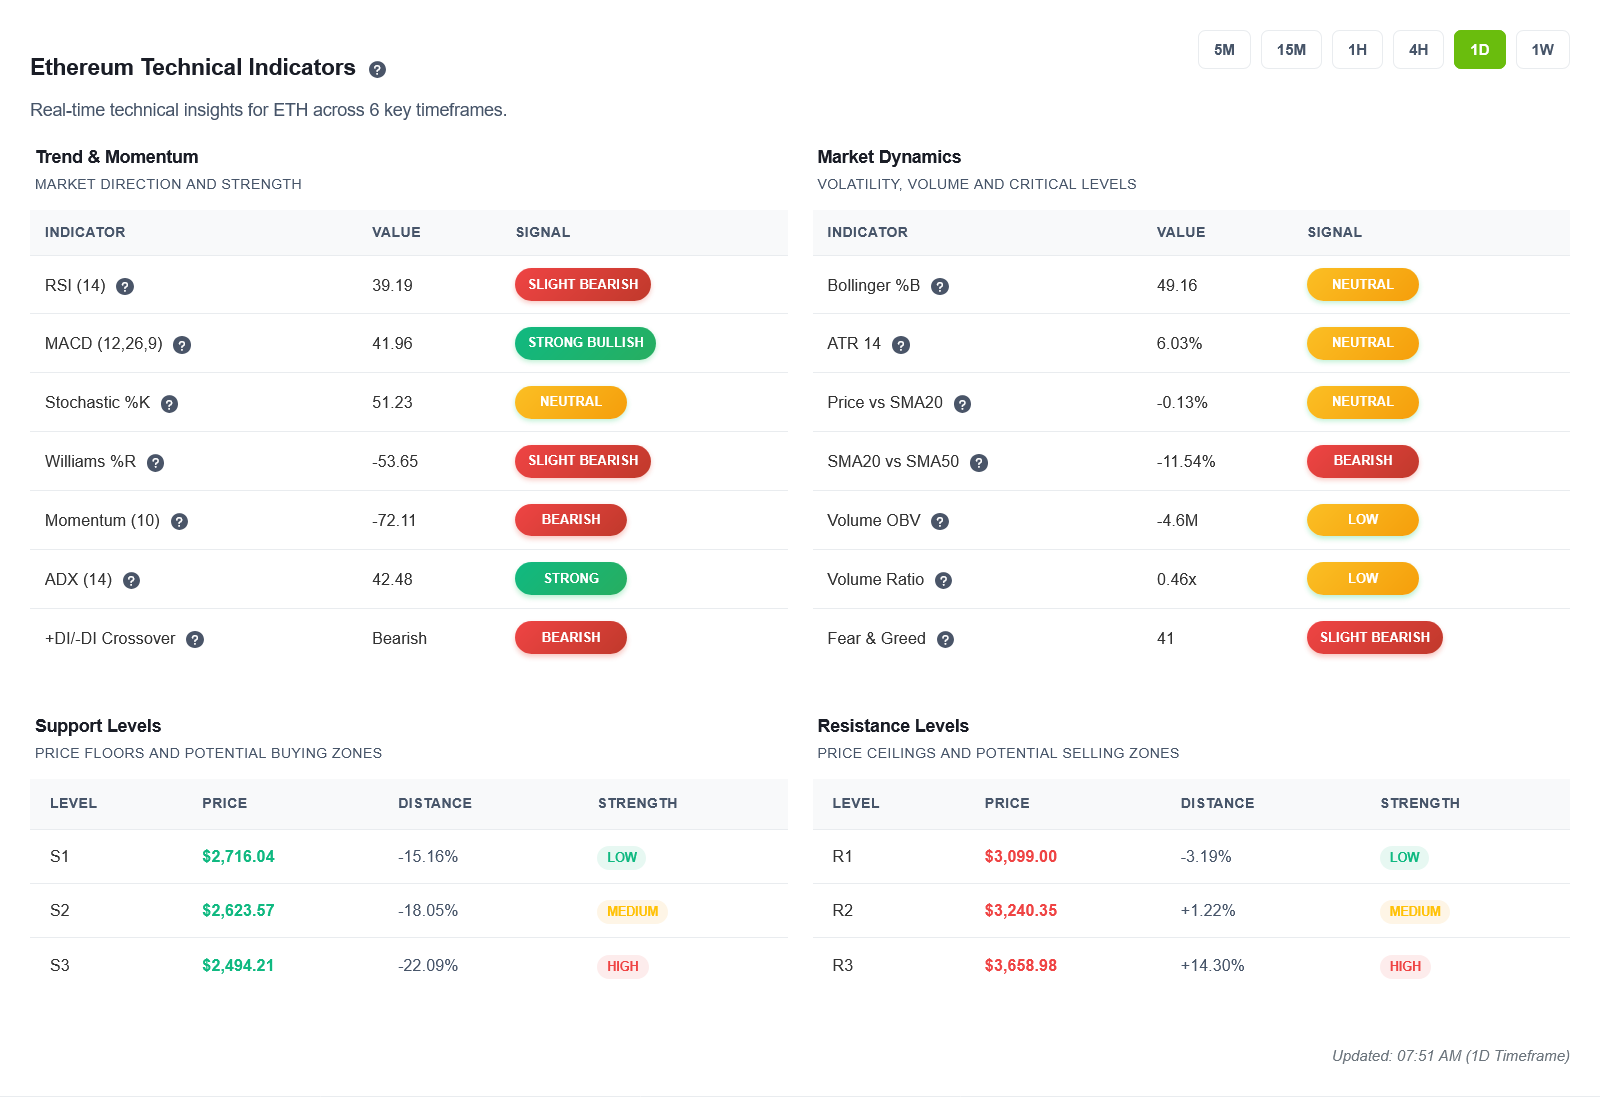
See it in action: Check the live technical analysis on our Bitcoin Price Prediction or Ethereum Forecast pages.
1. Trend Analysis & Moving Averages
Identifying the dominant market direction is the foundation of our analysis. We utilize a sophisticated blend of Simple and Exponential Moving Averages to filter noise and confirm valid trends. These are the core inputs for our Trend Consensus Engine.
Simple Moving Averages (SMA)
The SMA represents the average price over a specific period. It is our baseline for structural trend identification.
- SMA 20: Represents the short-term trend baseline.
- SMA 50: Represents the medium-term trend baseline.
- EMA 9: Ultra-responsive trend line for immediate price reaction
- EMA 20: Balanced sensitivity for short-term trend confirmation
- EMA 21: Slightly slower EMA for trend stability assessment
- SMA Alignment (SMA20 vs SMA50): We calculate the percentage distance between the SMA 20 and SMA 50. This alignment is a weighted factor in our Technical Outlook Decision Tree.
The "EMA Stack" (Trend Alignment)
Unlike standard platforms that rely on single crossovers, our engine calculates a proprietary EMA Stack State by analyzing the relationship between three specific Exponential Moving Averages: 9, 20, and 21.
[Image of EMA Stack Chart]
| State | Logic Condition | Interpretation |
|---|---|---|
| Bullish Stack | Price > EMA 9 > EMA 20 > EMA 21 | Strong upward momentum. Buyers are in full control with perfect trend alignment. |
| Bearish Stack | Price < EMA 9 < EMA 20 < EMA 21 | Strong downward pressure. Sellers are dominating the trend. |
| Neutral | MAs are intertwined | Choppy or consolidating market. No clear trend is defined. |
Price vs SMA Deviation
This metric measures the percentage distance between the current price and the SMA 20. It helps identify mean reversion opportunities.
- High Positive Value: Price is extended far above the average (Potential Pullback).
- High Negative Value: Price is extended far below the average (Potential Bounce).
2. Momentum & Oscillators
Momentum indicators quantify the speed of price movement to identify Overbought or Oversold conditions. Our system computes a weighted Momentum Strength Score based on the following inputs.
Relative Strength Index (RSI)
We calculate two distinct variations of the RSI to capture different market distincts:
- RSI-14 (Standard): The primary baseline for market sentiment (0-100). Levels >70 are overbought; <30 are oversold.
- RSI-6 (Fast): A highly sensitive version used to detect immediate, short-term reversals that the standard RSI might lag on.
- RSI Divergence: Our algorithm automatically compares price peaks vs. RSI peaks. If Price makes a Higher High but RSI makes a Lower High, a Bearish Divergence signal is generated.
if (price_high(n) > price_high(n-1) AND rsi(n) < rsi(n-1)) THEN bearish_divergence = true
Stochastic Oscillator
A momentum indicator comparing a particular closing price to a range of its prices over a certain period. We track the %K (current price) and %D (3-day average) lines. This is a key component in our Composite Fear & Greed Index.
- Bullish Crossover: When %K crosses above %D in oversold territory (<20).
- Bearish Crossover: When %K crosses below %D in overbought territory (>80).
Commodity Channel Index (CCI 20)
The CCI measures the current price level relative to an average price level over a given period. It is particularly effective for spotting new trends.
- > 100: Indicates the start of a new uptrend.
- < -100: Indicates the start of a new downtrend.
Williams %R
Similar to the Stochastic Oscillator but plotted on an inverted scale (0 to -100). It is exceptionally good at identifying market tops and bottoms in ranging markets.
Momentum (ROC 10)
The Rate of Change (10-period) measures the percentage change in price between the current price and the price 10 periods ago. It confirms the velocity of the move.
3. MACD Advanced Analysis
We do not just calculate the standard MACD; we run dual configurations to catch different trend speeds. These signals contribute 5% weight to our Trend Consensus model.
MACD Configurations
| Type | Settings (Fast, Slow, Signal) | Purpose |
|---|---|---|
| MACD Slow (Standard) | 12, 26, 9 | Reliable trend following and general signal generation. |
| MACD Fast (Aggressive) | 8, 21, 5 | Early warning system for rapid trend changes. |
MACD Component
For each MACD configuration, we extract and analyze three components:
- MACD Line: Fast EMA minus Slow EMA
- Signal Line: 9-period EMA of MACD Line (or 5-period for fast config)
- Histogram: MACD Line minus Signal Line (momentum strength)
MACD Momentum Ratio
A proprietary metric derived by dividing the MACD Histogram by the Signal Line. This quantifies the acceleration of the trend. A rising ratio indicates the trend is strengthening, while a falling ratio signals momentum decay.
4. Volatility & Market Risk
Volatility indicators expand and contract based on market activity. These metrics are the primary drivers for our Risk Assessment Engine.
Bollinger Bands
A set of three bands defined by a 20-period SMA and standard deviation lines.
- BB Position %: Quantifies where the price sits within the bands. 100% = Upper Band, 0% = Lower Band.
- BB Width %: Measures market volatility. A very low width indicates a "Squeeze," often predicting a violent breakout.
Average True Range (ATR)
The ATR measures market "noise" or volatility intensity. We calculate the ATR Percentage (ATR / Price) to normalize volatility across assets. This feeds directly into our Volatility Level Indicator.
- High ATR %: High risk, large price swings (Stop losses should be wider).
- Low ATR %: Low risk, stable price action (Stop losses can be tighter).
- Volatility Classification: Based on ATR% ranges:
- 0-2%: Very Low Volatility
- 2-5%: Low Volatility
- 5-10%: Moderate Volatility
- 10-20%: High Volatility
- 20%+: Extreme Volatility
5. Trend Strength (ADX/DMI)
The Average Directional Index (ADX) system determines the strength of a trend and whether buyers or sellers are dominant.
Components
All calculations based on 14-period standard:
- ADX (14): Measures trend strength (0-100). Values above 25 indicate a trending market; values below 20 indicate a ranging market.
- +DI (Plus Directional Indicator): Measures bullish strength.
- -DI (Minus Directional Indicator): Measures bearish strength.
- DI Ratio & Crossover: We analyze the spread between +DI and -DI. A "Bullish Crossover" occurs when +DI crosses above -DI.
Trend Strength Classification
| ADX Value | Trend Strength | Trading Implication |
|---|---|---|
| 0-20 | Absent or Very Weak | Avoid trend-following strategies |
| 20-25 | Weak | Caution with trend positions |
| 25-50 | Strong | Ideal for trend following |
| 50-75 | Very Strong | Powerful trending market |
| 75+ | Extreme | Potential trend exhaustion |
6. Volume Intelligence
Price movement without volume is often a trap. We analyze volume flow to confirm the validity of price action, creating our Volume Sentiment profile.
On-Balance Volume (OBV)
On-Balance Volume tracks cumulative buying and selling pressure by adding volume on up days and subtracting on down days. When OBV moves with price, the trend is confirmed.
Signal Classification
| Signal Level | Volume Direction | Price Movement | Market Implication |
|---|---|---|---|
| very_high | Positive (Buying) | Strong Rise (>5%) | Maximum bullish conviction - Strong trend confirmation |
| high | Positive (Buying) | Mild Rise (2-5%) | Bullish alignment - Healthy accumulation |
| above_normal | Positive (Buying) | Neutral/Slight Move | Moderate buying pressure - Slight bullish bias |
| neutral | Near Zero | Minimal Movement | Balanced market - No clear volume direction |
| below_normal | Negative (Selling) | Neutral/Slight Move | Moderate selling pressure - Slight bearish bias |
| low | Negative (Selling) | Mild Drop (-2 to -5%) | Bearish alignment - Controlled distribution |
| very_low | Negative (Selling) | Strong Drop (< -5%) | Maximum bearish conviction - Strong selling pressure |
Divergence Signals (Special Cases)
- Bullish Divergence: Price is flat or falling, but OBV is rising (Smart money accumulation).
- Bearish Divergence: Price is rising, but OBV is falling (Smart money distribution).
Volume Ratio
Volume Ratio is one of our most powerful yet straightforward metrics, measuring whether current trading activity represents normal participation, unusual interest, or concerning lack of conviction.
Core Concept: Volume Ratio compares current trading volume against the 20-period average. A ratio of 1.0 means volume is exactly average. Above 1.0 indicates above-average interest, while below 1.0 suggests below-average participation.
Signal Classification
| Volume Ratio | Our Signal | Category | Typical Market Condition |
|---|---|---|---|
| > 3.0 | VERY_HIGH | Extreme Volume | Breakouts, breakdowns, capitulation |
| 2.0 - 3.0 | HIGH | Very High Volume | Strong trending moves, important news |
| 1.5 - 2.0 | ABOVE_NORMAL | Elevated Volume | Sustained trends, accumulation/distribution |
| 0.8 - 1.5 | NEUTRAL | Normal Volume | Regular trading, consolidation |
| 0.5 - 0.8 | BELOW_NORMAL | Low Volume | Holiday trading, indecision phases |
| 0.3 - 0.5 | LOW | Very Low Volume | Thin markets, pre-breakout consolidation |
| < 0.3 | VERY_LOW | Extremely Low Volume | Illiquid conditions, potential for sharp moves |
Context Matters: Combining with Price Action
The same Volume Ratio can mean different things depending on price movement:
| Volume Ratio | With Rising Price | With Falling Price | With Sideways Price |
|---|---|---|---|
| HIGH (>2.0) | Bullish confirmation Strong buying interest |
Bearish confirmation Strong selling pressure |
Breakout imminent Accumulation before move |
| LOW (<0.5) | aution - weak rally Lacks conviction |
Potential exhaustion Sellers losing steam |
Consolidation continues No urgency to move |
| NEUTRAL (0.8-1.5) | Healthy gradual rise Sustainable movement |
Orderly decline Controlled selling |
Balanced market Equal forces |
7. Proprietary & Composite Metrics
These indicators are custom-built by our team, aggregating data from multiple standard indicators to provide high-level insights. Learn more about our detailed logic on the Methodology Page.
Algorithmic Swing Levels (Support & Resistance)
Instead of static psychological lines, our engine scans the last 50 periods for "Fractal" Swing Highs and Swing Lows. These form the basis of our Key Levels Analysis.
- Methodology: A level is confirmed only when a price peak has two lower highs on the left and two lower highs on the right.
- Output: The system generates dynamic S1, S2, S3 (Support) and R1, R2, R3 (Resistance) levels that adapt to market structure.
Composite Fear & Greed Index
We calculate a unique Fear & Greed score for every individual coin based on 5 weighted components. For a complete breakdown of component weights, visit our Market Sentiment Methodology.
Component Weighting Table
| Component | Weight | Key Indicators Analyzed | Psychological Factor Measured |
|---|---|---|---|
| Momentum | 25% | RSI-14, RSI-6, Stochastic %K/%D, Williams %R, CCI, Momentum-10 | Short-term trader excitement/panic |
| Trend | 30% | Price Change %, Price vs SMA20, EMA Stack State, ADX, DI Crossover | Overall market confidence/doubt |
| Volume Sentiment | 25% | Volume Ratio, OBV Signal, Volume Divergences | Smart money accumulation/distribution |
| Market Sentiment | 10% | Social mentions, News sentiment, Search trends, Whale activity | Crowd psychology & media influence |
| Volatility | 10% | ATR Percentage, BB Width %, Price spike magnitude | Market uncertainty & risk perception |
Final Score Interpretation
- 0-24: Extreme Fear (Potential buying opportunity)
- 25-39: Fear (Cautious sentiment)
- 40-44: Slight Bearish (Mild negative bias)
- 45-54: Neutral (Balanced market)
- 55-59: Slight Bullish (Mild positive bias)
- 60-69: Greed (Optimistic sentiment)
- 70-100: Extreme Greed (Potential selling opportunity)
Disclaimer: Technical analysis is a probabilistic tool, not a crystal ball. These indicators are calculated mathematically to provide data-driven insights but should always be used as part of a diversified risk management strategy.